When I need to travel somewhere, I open a map. When people plan logistics, they use diagrams. Businesses draw process charts. Armies use maps too.
Software is not simpler than any of those systems, yet a surprising amount of day-to-day understanding still depends on something much less reliable: the map in a developer’s head. That feels normal only because we are used to it.
We already build these maps, just informally
Whenever we explore a codebase, some form of mapping starts happening, whether we mean to or not.
We move between modules, follow calls, try to understand which part talks to which, and gradually assemble a picture of the system. Sometimes that picture stays in our heads. Sometimes it ends up on paper. I know I am not the only one who works this way.
So the mapping itself is not optional. We already do it. The problem is that the map is usually temporary.
A few months later, or a year later, returning to the same code often means reconstructing the whole thing again. We reopen files, retrace relationships, reread docs, ask teammates, search logs, and slowly rebuild context we used to have.
That is manageable once or twice. It becomes expensive when you switch between projects often, when the product is large, or when several teams work on the same app.
At some point, restoring context becomes one of those invisible costs that everybody pays and nobody tracks.
Code is the source of truth, but not the easiest way to regain context
People often say that the best documentation is the code itself, and there is truth in that. Code tends to be more current than separate documentation because it directly defines the system’s behavior. When behavior changes, code usually has to change too.
Still, source code is not always the best interface for understanding a system quickly. There is often too much of it. Even in a well-structured project, understanding the whole application from source alone takes time. And not every codebase is tidy enough to explain itself.
Documentation helps, but only when it exists, is good, and is still up to date. In real projects that is a fragile combination.
Comments are closer to the code, which makes them more likely to stay relevant, but comments are written primarily for people. They are not a structured model of the system.
So there is a gap here. Code is authoritative, documentation is selective, and the mental model in a developer’s head fades faster than we would like.
Some maps do exist already, but they solve different problems
To be fair, software development is not completely mapless.
If you work with Flutter, you already have Flutter Inspector in DevTools. It lets you visualize and navigate the widget tree, inspect nearby widgets, and connect what you see on screen to nodes in the tree. That is genuinely useful.
Other ecosystems have their own kinds of visual structure too. JetBrains IDEs can generate UML class diagrams for code structure and database diagrams for schemas and relations. MySQL Workbench has EER diagrams that visualize table relationships in a model.
These tools are valuable, but they are not quite the thing I was missing.
Flutter Inspector shows UI hierarchy. UML diagrams show static relationships in code. Database diagrams show schema structure. All of that matters, but none of it really answers the question that keeps coming up while debugging or returning to an old feature: what is happening in the app right now, across its modules and flows, and how is that behavior moving through the system? That is a different kind of map.
Logs are much closer to the answer than they seem
Logs are often treated as a low-level debugging aid, but I think they are more important than that.
A good log already tells us a lot. At minimum, it usually says that something happened, and when it happened. With decent conventions, it often also hints at where it happened. That is already the beginning of a model.
Logs also live close to the real behavior of the application. They are not a separate artifact that somebody may or may not remember to update later. If a team relies on logs for debugging, those logs are much more likely to stay relevant than a diagram in a wiki.
The limitation is different: a plain log stream is linear. It scrolls away. It competes for your attention. If an important warning appears while you are looking somewhere else, you can miss it completely. A single line in a console is often too weak a trace for something that actually matters.

The same problem appears with filtering. Teams often invent naming conventions, prefixes, and keywords, and that definitely helps. But it still assumes you already know what you are looking for. It does not help much when you only have a vague sense that something in a certain part of the system is wrong.
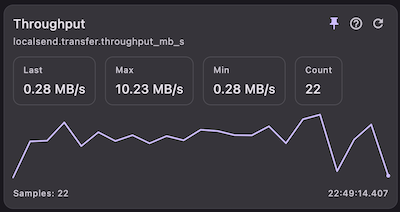
Then there are values I want to watch over time. A debugger helps, of course: breakpoints are great when I need to stop at a particular moment and inspect state. But that is not quite the same thing. Often I do not want a frozen snapshot — I want to observe how a value changes while the app keeps running. In practice, that usually means either staring at logs continuously or building one-off debug UI, and neither option feels like a satisfying general solution.
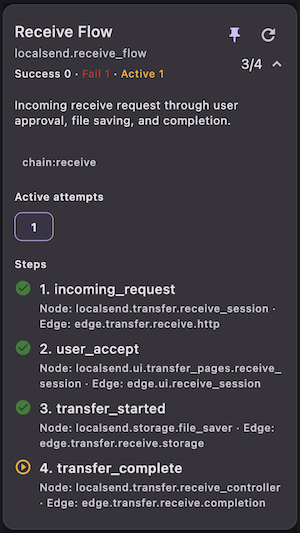
And then there are event chains. Most features have some form of happy path: a user action leads to state changes, side effects, network calls, maybe more UI updates. When the chain breaks, reconstructing it from raw logs can be painfully manual. That is the point where I stop wanting “better logs” and start wanting a different interface to runtime behavior.
The missing piece is not more text, but more structure
At that point, the problem starts to look less like logging itself and more like representation.
If a runtime event happens inside a module, that module matters. If it happens between two parts of the system, then the connection between those parts matters too. Once you think in those terms, isolated log lines start to look like fragments of a graph.
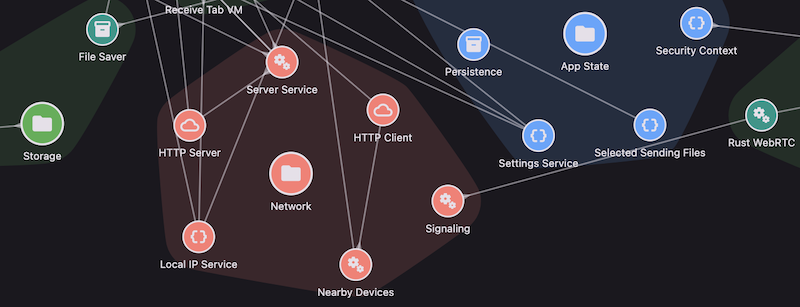
And real systems usually have more than one type of relationship. There is flow, but there is also hierarchy. A screen belongs to a feature. A component belongs to a module. A service belongs to some subsystem. These relationships are not just documentation trivia; they shape how we understand behavior.
So a better logging system, at least in my view, should not only record messages. It should help represent:
- system elements
- connections between them
- hierarchy
- events flowing through that structure
- tags and filters
- counters and alerts
- parameters and live values
- event chains across multiple steps
That starts to look less like logging in the traditional sense and more like a runtime map.
AI does not remove this need
LLMs are powerful and here to stay. But they don’t eliminate the need for maps; if anything, they make that need even more obvious.
You can ask an AI tool to inspect a repository and explain how a feature works, but the answer depends on the model, the prompt, the context window, and which parts of the code were actually included. Two developers can get two different explanations of the same system.
Sometimes that is fine. Sometimes it is useful. But it is not a stable representation.
A compact, structured map of a codebase or of runtime behavior can play a different role. It can help a person return to context faster, and it can give AI tools a more grounded layer to reason over. In large projects, that kind of abstraction is not just a nice extra. It can be one of the few practical ways to hold on to the overall picture without constantly diving back into the raw code.
Why I built Uyava
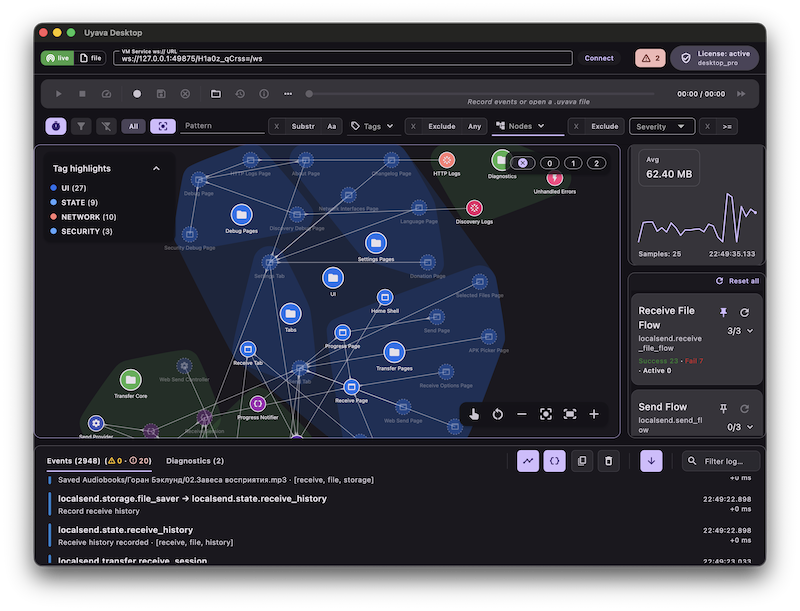
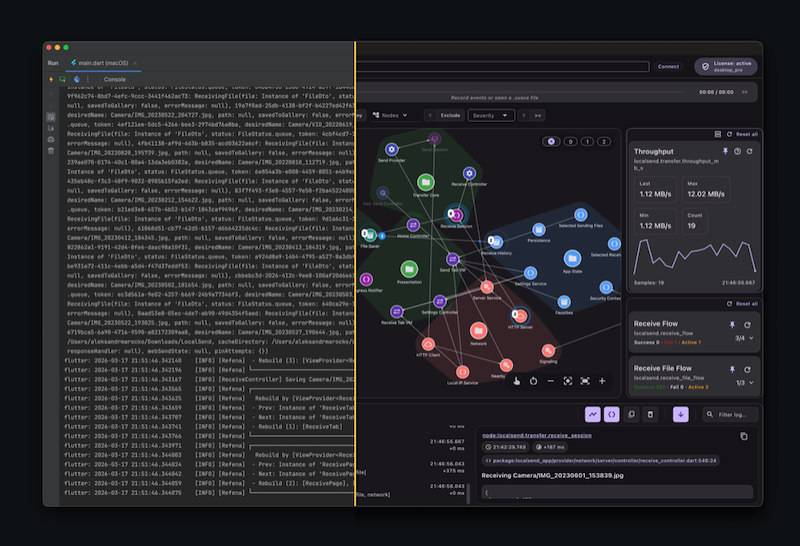
This line of thinking eventually turned into Uyava.
What I wanted was fairly simple: a way to look at runtime behavior as a system, not just as a stream of log lines. Something visual enough to keep the overall picture in view, but still close to the real behavior of the app. That is what Uyava is trying to be.
Today, Uyava is a tool for Flutter apps. It is the current scope of the project, and that is where the work is happening right now.
There are also a couple of directions I want to explore next. One of them is a Local API mode, so Uyava Desktop can be driven from any app or module through localhost commands instead of being tied to a single integration style. Another is MCP support, so AI tools can interact with the app, with Uyava’s metadata layer, and with the current runtime state in a more direct and structured way.
For now, though, the main idea is much simpler than any roadmap: make runtime behavior easier to see, follow, and understand.
If this resonates with you, I would be glad to hear your feedback, ideas, or use cases. You can reach me at support@uyava.io.
Oleksandr Marochko
Flutter Developer